Was this page helpful?
Caution
You're viewing documentation for a previous version of ScyllaDB Monitoring. Switch to the latest stable version.
Alerting
Alerts are a Prometheus enhancement to notify that something is wrong in the system.
You can read more about Prometheus alerting here
By default, alerts are shown in the overview dashboard, but you can also configure the alerts to be sent to other external systems like email or slack.
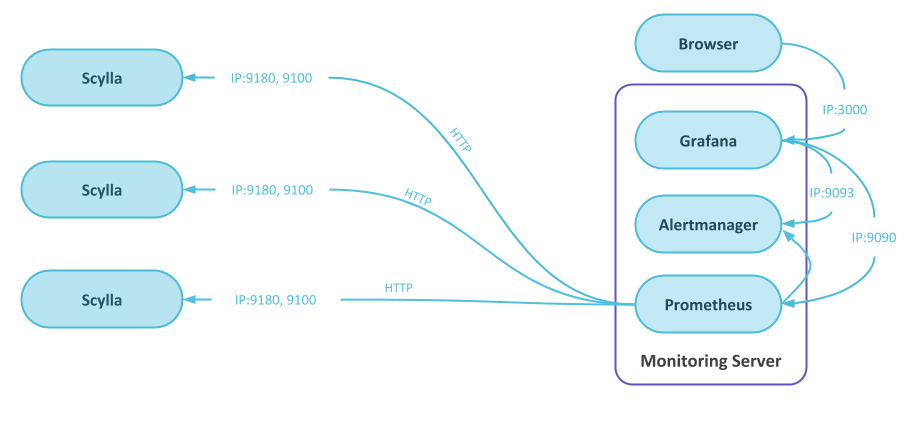
In general, alerts are generated by Prometheus when a specific condition is met within a certain period of time, they are then sent to the Alertmanager, that can send them to external systems.
The Alertmanager also acts as a data source for Grafana so the active alerts are shown in the dashboard.
Prometheus Alerts
The Prometheus alerts are defined in files placed under prometheus/prom_rules/. Prometheus will load any file that ends with yml or yaml.
Each Prometheus alert consists of:
Name
What happened
For how long
What to report
For example, let us look at the InstanceDown alert that comes by default as part of Scylla-Monitoring.
- alert: InstanceDown
  expr: up == 0
  for: 60s
  labels:
    severity: "error"
  annotations:
    description: '{{ $labels.instance }} has been down for more than 30 seconds.'
    summary: Instance {{ $labels.instance }} down
The expr is a legal Prometheus expression, in this case, the up metric is equal to 0.
The for set the minimal duration before the alert will be active. Prior to that, the alert will be in pending-mode and will not be sent.
The labels part holds additional labels that will be added to the alert, in the example, the severity label will be set to error.
annotations are special labels that add a description to the alert and can be used in emails and notification when the alert is forward to external systems.
Alerts severity
Prometheus uses the following severities from low to high: info, warn, error, critical.
The Alertmanager inhibition rule (see the Alertmanager section) makes sure that an alert with higher priority will mute the lower priority rule. For example, out-of-disk space alerts have different thresholds, this way when the error alert for disk-full is firing, it silences the warn alert.
When adding your own alerts, you can use the severities to signal the action’s importance, for example critical would be a pager-duty, while an error will be an email.
Adding Alerts
Add your own alerts in a separate file with a yml or yaml extension. Making it easier during upgrade.
Modifying Alerts
It is a common practice to update the alerts that comes with the monitoring stack. Verify that the existing alerts suitable to your needs. When modifying an alert, remember that it will be overridden on you next upgrade.
Alertmanager
The Alertmanager gets the alerts from the Prometheus server responsible for duplicating, grouping and routing.
The Alertmanager configuration is found in rule_config.yml file that is located in the prometheus directory. The configuration consists of three parts:
Routes: Represent a routing tree, the most specific rule, wins
Inhibition: Mute an alert, based on another alert
Receiver: Send a notification via email, sluck, etc’
Check the Alertmanager documentation for details on how to specify a specific receiver.
In the default configuration, the Grafana server will use the Alertmanager as a data source for the alert table found in the overview dashboard.
Tips When Adding an Alert
It’s worse having an alert that does not work, than not having an alert at all
There are multiple ways you can use to make sure your alert is set correctly:
Start with making sure that the full path (alert to mail or dashboard) is working a simple way is by negating the logic.
Force the alert to be active by reducing the limits or the duration.
When possible simulate the actual scenario and see that the alert works as expected.
For example, low available disk space.
Assume that you want an alert when you have lower than 10% disk space. You can start by setting the alert that is fired when you have more than 10% disk space. That would show that the alert is active and is propagated to the dashboard and to any external system you are using. You can then set the alert rule to a value similar to the current situation.
Now you are sure that when setting the expression to alert when the free space below 10% the alert would work, but if possible, simulate that situation, in this case by creating some big files.
Starting with a simple working expression helps you bisect problems.