Was this page helpful?
Caution
You're viewing documentation for a previous version of ScyllaDB Monitoring. Switch to the latest stable version.
Scylla Monitor
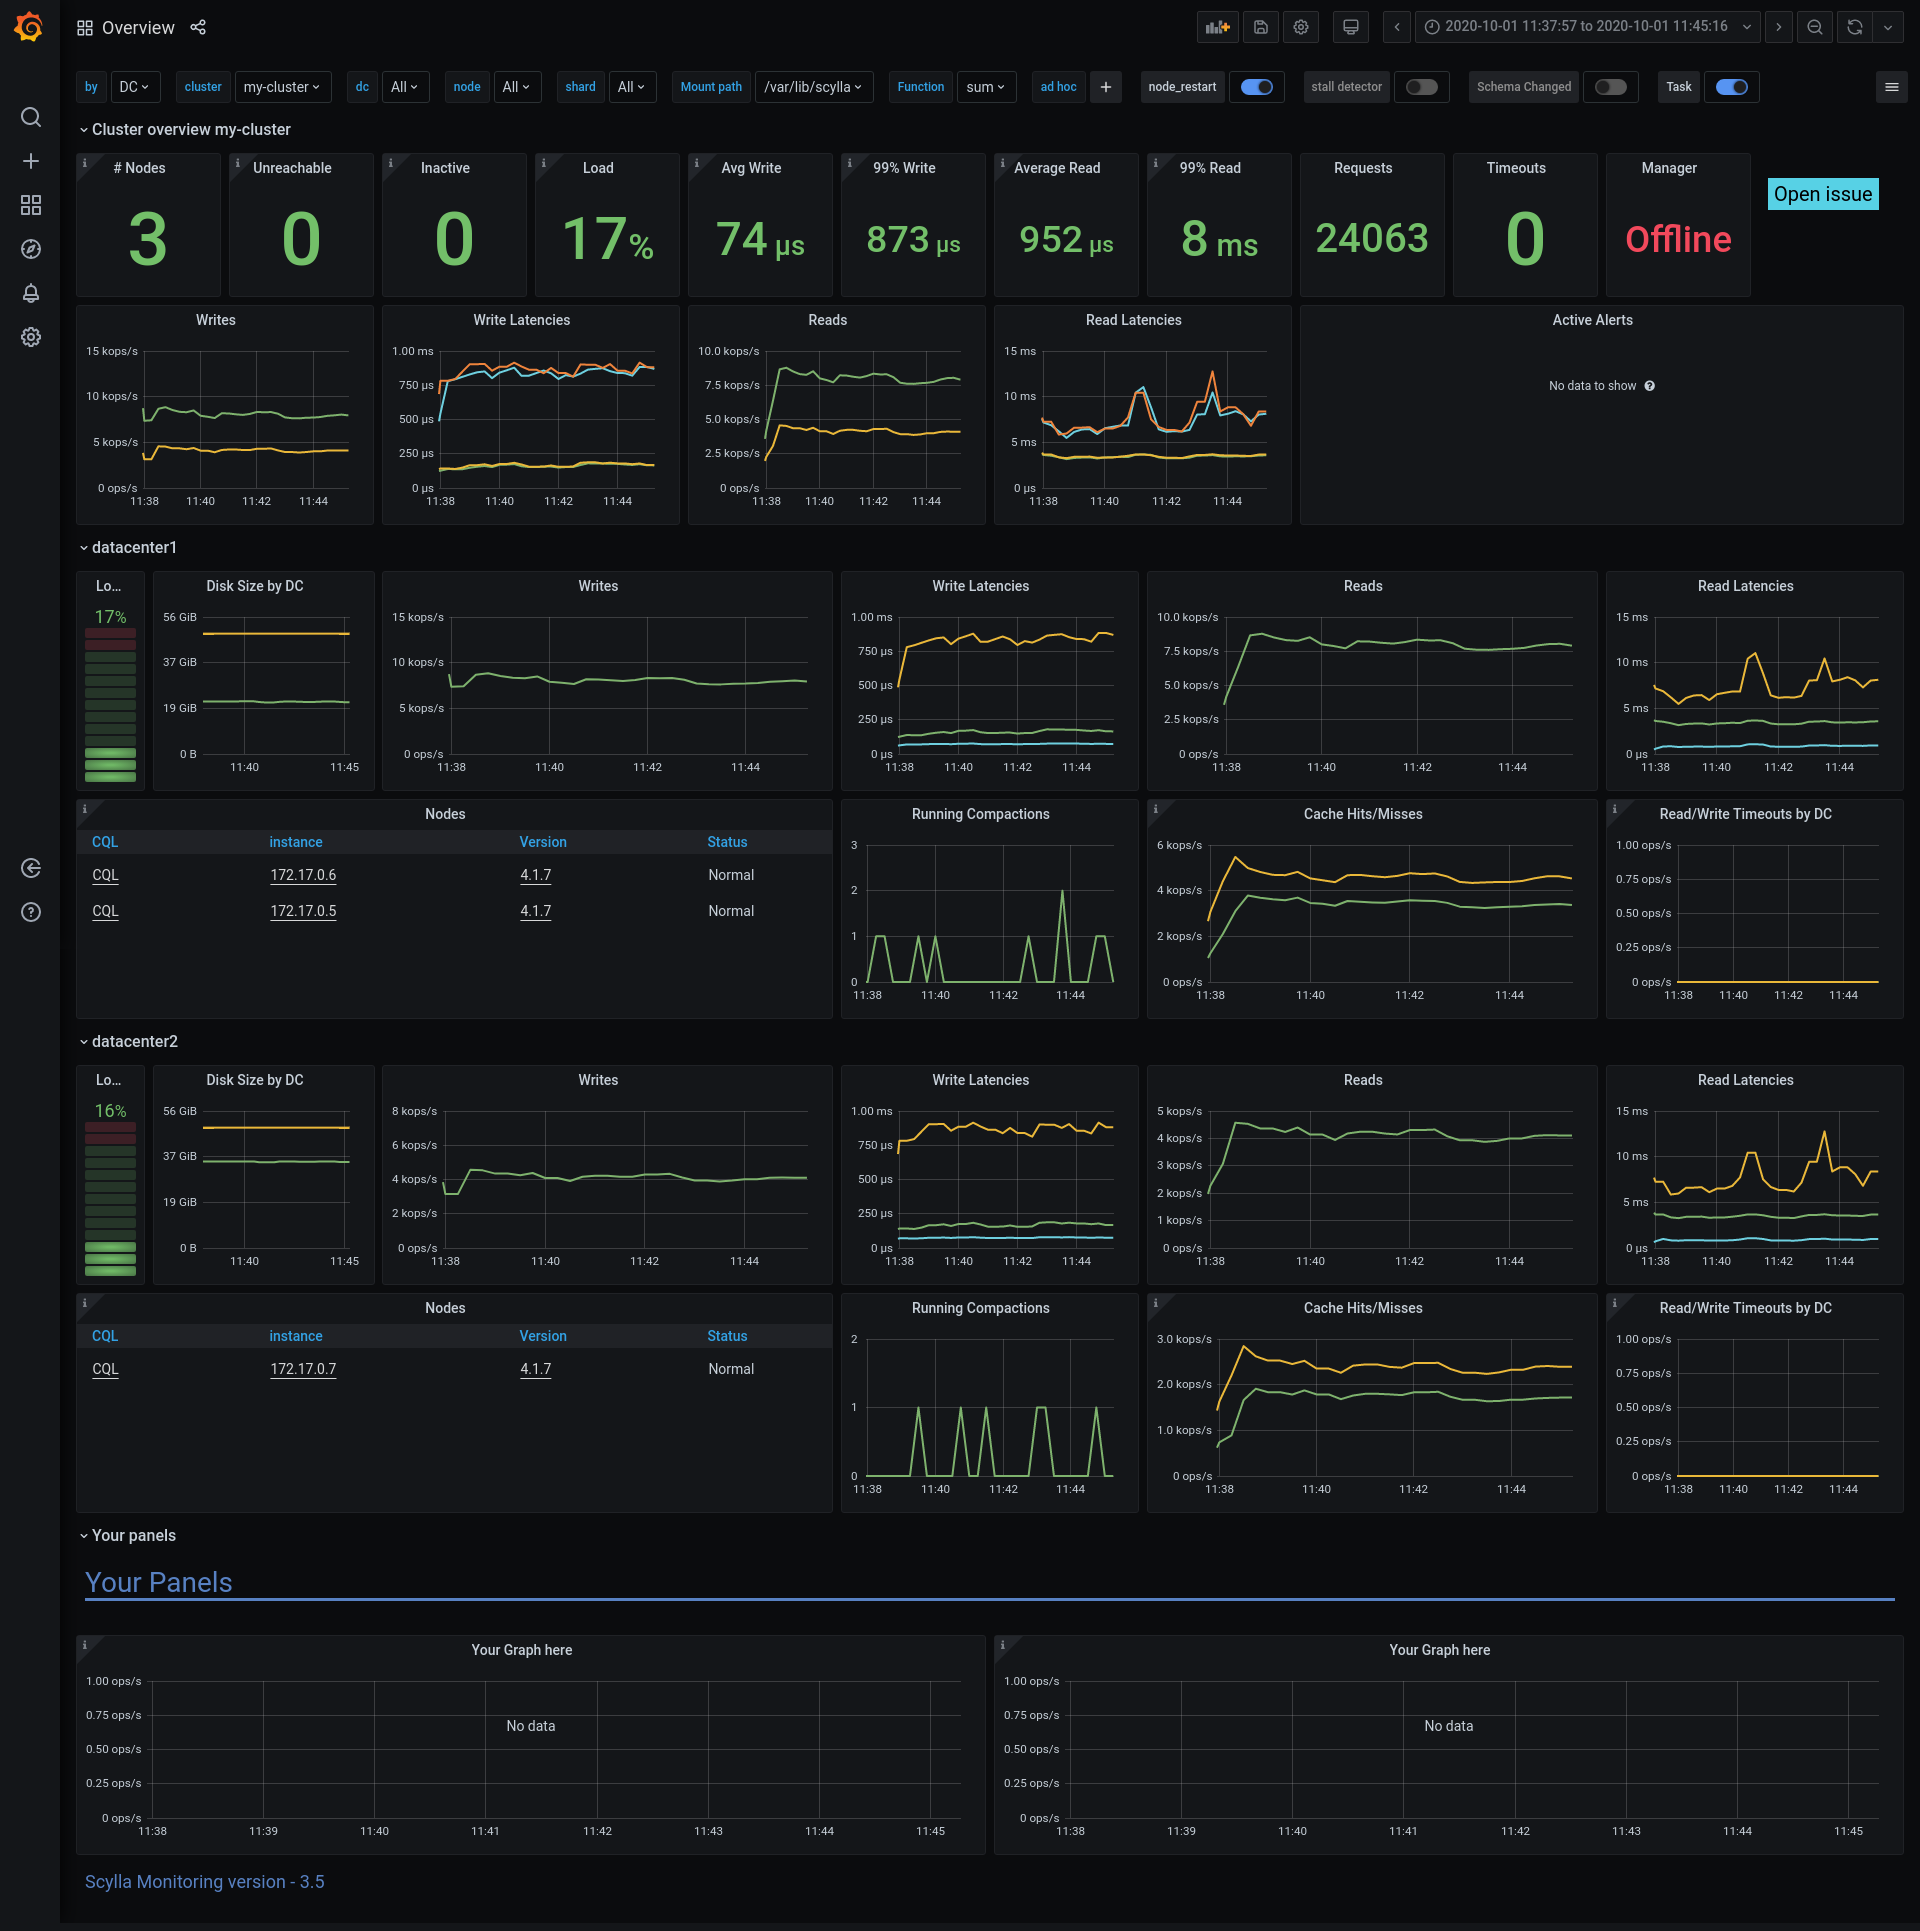
Scylla Monitor is a full stack for Scylla monitoring and alerting. The stack contains open source tools including Prometheus and Grafana, as well as custom Scylla dashboards and tooling.
For older versions of Scylla Monitoring see here.

The Scylla Monitor Stack consists of three components, wrapped in Docker containers:
prometheus - collects and stores metrics
alertmanager - handles alerts
grafana - dashboard server
Choose a topic to get started:
