ScyllaDB University Live | Free Virtual Training Event
Learn more
ScyllaDB Documentation Logo Documentation
  • Server
  • Cloud
  • Tools
    • ScyllaDB Manager
    • ScyllaDB Monitoring Stack
    • ScyllaDB Operator
  • Drivers
    • CQL Drivers
    • DynamoDB Drivers
  • Resources
    • ScyllaDB University
    • Community Forum
    • Tutorials
Download
ScyllaDB Docs ScyllaDB Monitoring ScyllaDB Monitoring Stack Procedures Scylla Monitoring Datadog Integration

Caution

You're viewing documentation for a previous version of ScyllaDB Monitoring. Switch to the latest stable version.

Scylla Monitoring Datadog Integration

The safest way to use Datadog with Scylla is to load the metrics, using a Datadog Agent, from a Prometheus server and not directly from Scylla nodes. The integration consists of:

  1. Installing and configuring the Datadog Agent.

  2. Add datadog recording rules.

  3. Loading Scylla dashboard to Datadog.

  4. Optionally load Monitor (Alerts).

Note

Scylla Cloud users, use and update the proper configuration file.

Install And configure the Datadog Agent

Start by following Installation guide. The datadog agent should run on a machine that can reach the Prometheus server.

Once the Datadog agent is working, download the configuration file and place it under /etc/datadog-agent/conf.d/prometheus.d/conf.yaml

Scylla Cloud Users

Scylla Cloud users, download the configuration file conf.yaml move it to: /etc/datadog-agent/conf.d/prometheus.d/conf.yaml

Edit the file. You must replace the cluster id (CLUSTER_ID) and the token (TOKEN).

Other Scylla Users

Other Scylla users, download the configuration file conf.yaml and replace the ip address of the promemtheus server.

Post configuration

Restart the agent based on your installation. Scylla metrics should be visible in Datadog.

Note

By default, Datadog will not scrap per-shard metrics. To enable per-shard metrics, edit the conf.yaml file and replace dd=~”1” with dd=~”1|2”

Add datadog recording rules

Non cloud users, download the rules configuration file datadog.rules.yml and place it under prometheus/prom_rules/.

Upload the Dashboard

Download the dashboard file dashboard.json. Create a new dashboard in Datadog and import the json file you downloaded.

Using the Dashboard

We created a Datadog dashboard that resembles the Grafana dashboards available to Scylla and Scylla-Cloud users.

../../_images/datadog.png

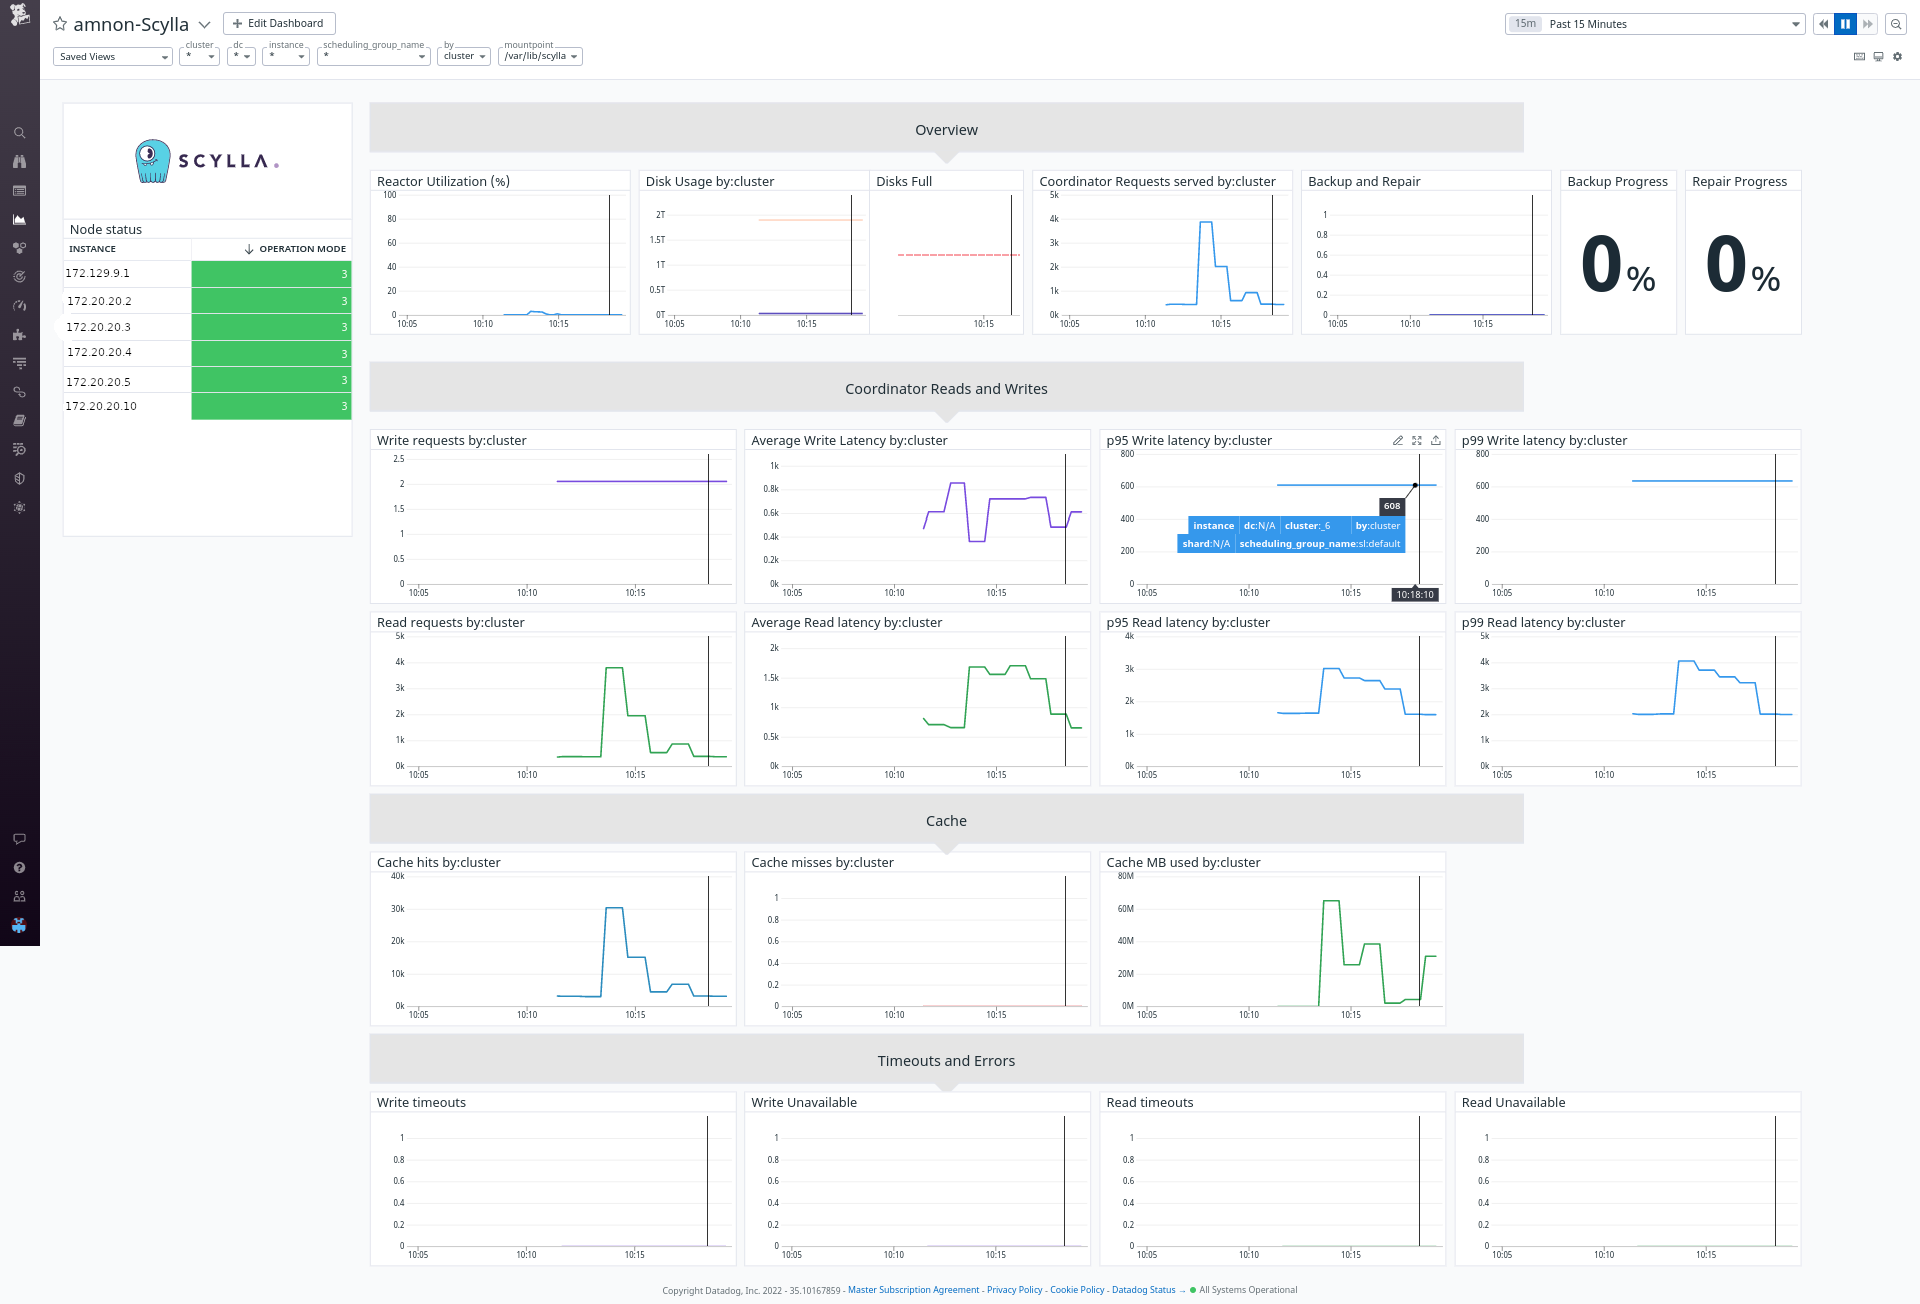
The dashboard contains some specific filtering and perspectives: First, you can choose between shard, instance, dc, or cluster view. This will aggregate the metrics in the graphs accordingly. Second, you can filter to see specific shards, nodes, or DCs.

Note

Pay attention that some of the combinations are conflicting. For example, you cannot filter by DC when looking at a cluster view. If no data displayed, remove the filters first.

Adding Monitor

Alerts in Datadog called Monitor. Download the monitor file monitor.json. Go to the Monitor section in datadog and import the json.

Was this page helpful?

PREVIOUS
ScyllaDB Monitoring Stack Procedures
NEXT
Scylla Monitoring Stack Alert Manager
  • Create an issue
  • Edit this page

On this page

  • Scylla Monitoring Datadog Integration
    • Install And configure the Datadog Agent
      • Scylla Cloud Users
      • Other Scylla Users
      • Post configuration
    • Add datadog recording rules
    • Upload the Dashboard
    • Using the Dashboard
    • Adding Monitor
ScyllaDB Monitoring
  • 4.3
    • 4.9
    • 4.8
    • 4.7
    • 4.6
    • 4.5
    • 4.4
    • 4.3
    • 4.2
    • 4.1
    • 4.0
    • 3.10
    • 3.9
    • 3.8
    • 3.7
    • 3.6
    • 3.5
  • Introduction
  • Download and Install
    • Install
    • The start-all.sh script
    • Deploy without Docker
    • Docker Compose
    • System Recommendations
    • Using Thanos
  • User Guide
    • CQL Optimization Dashboard
    • Advisor
      • Some queries use ALLOW FILTERING
      • Some queries use Consistency Level: ALL
      • Some queries use Consistency Level: ANY
      • Some queries are not token-aware
      • Some SELECT queries are non-paged
      • Some queries are non-prepared
      • Some queries use reverse order
      • Compaction takes lots of memory and CPU
      • Some operation failed due to unsatisfied consistency level
      • I/O Errors can indicate a node with a faulty disk
      • Some operations failed on the replica side
      • CQL queries are not balanced among shards
      • Prepared statements cache eviction
      • System Overload
  • Procedures
    • Datadog Integration
    • Alert Manager
      • Alerting
    • Adding and Modifying Dashboards
    • Upgrade Guides
      • Monitoring 3.x to 4.y
      • Monitoring 3.x to 3.y
      • Monitoring 2.x to 3.y
      • Monitoring 2.x to 2.y
      • Monitoring 1.x to 2.x
  • Upgrade
    • Monitoring 3.x to 4.y
    • Monitoring 3.x to 3.y
    • Monitoring 2.x to 3.y
    • Monitoring 2.x to 2.y
    • Monitoring 1.x to 2.x
  • Troubleshooting
    • Troubleshooting
    • Troubleshooting Guide for Scylla Manager and Scylla Monitor Integration
  • Reference
    • Support Matrix
    • Interfaces
  • GitHub Project
Docs Tutorials University Contact Us About Us
© 2025, ScyllaDB. All rights reserved. | Terms of Service | Privacy Policy | ScyllaDB, and ScyllaDB Cloud, are registered trademarks of ScyllaDB, Inc.
Last updated on 04 May 2025.
Powered by Sphinx 7.4.7 & ScyllaDB Theme 1.8.6