Was this page helpful?
Caution
You're viewing documentation for a previous version of ScyllaDB Monitoring. Switch to the latest stable version.
Upgrade Guide - Scylla Monitoring 3.x to Scylla Monitoring 4.y
This document is a step by step procedure for upgrading ScyllaDB Monitoring Stack from version 3.x to 4.y, for example, between 3.9 to 4.0.0.
Upgrade Procedure
We recommend installing the new release next to the old one. You can run both monitoring stacks in parallel, ensuring it is working as expected before uninstalling the old version.
Change to the directory you want to install the new Monitoring stack. Download the latest release in the .zip or .tar format.
Install 4.y (The new version)
wget -L https://github.com/scylladb/scylla-monitoring/archive/scylla-monitoring-4.y.zip
unzip scylla-monitoring-4.y.zip
cd scylla-monitoring-scylla-monitoring-4.y/
Replace “y” with the new minor and patch release number, for example, 4.0.0.zip
Note
For versions 4.7.* and above, use the format 4.7.*.zip, for example:
wget -L https://github.com/scylladb/scylla-monitoring/archive/4.7.1.zip
unzip 4.7.b.zip
cd scylla-monitoring-4.7.b/
Setting the server’s files
Copy the scylla_servers.yml and scylla_manager_servers.yml from the version that is already installed.
cp /path/to/monitoring/3.x/prometheus/scylla_servers.yml prometheus/
cp /path/to/monitoring/3.x/prometheus/scylla_manager_servers.yml.yml prometheus/
Validate the new version is running the correct version
run:
./start-all.sh --version
To validate the Scylla-Monitoring version.
Running in test mode
This section is optional. It shows you how to run two monitoring stacks side by side. You can skip this section entirely and move to switching to the new version section.
Running second monitoring stack
We need to use different ports to run two monitoring stacks in parallel (i.e., the older 3.x version and the new 4.x stack).
./start-all.sh -p 9091 -g 3001 -m 9095
Browse to http://{ip}:9091 and check the Grafana dashboard.
Note that we are using different port numbers for Grafana, Prometheus, and the Alertmanager.
Caution
Important: do not use the local dir flag when testing!
When you are satisfied with the data in the dashboard, you can shut down the containers.
Caution
Important: Do not kill the 3.x version that is currently running!
Killing the new 4.y Monitoring stack in testing mode
Use the following command to kill the containers:
./kill-all.sh -p 9091 -g 3001 -m 9095
You can start and stop the new 4.y version while testing.
Migrating
Move to version 4.y (the new version)
Note: migrating will cause a few seconds of blackout in the system.
We assume that you are using external volume to store the metrics data.
Backup
We suggest to copy the Prometheus external directory first and use the copy as the data directory for the new monitoring stack. Newer Monitoring stack uses newer Promethues versions, and keeping a backup of the prometheus dir would allow you to rollback.
Kill all containers
At this point you have two monitoring stacks installed with the older version running.
If you run the new version in testing mode kill it by following the instructions on how to Killing the new 4.y Monitoring stack in testing mode in the previous section.
kill the older 3.x version containers by running:
./kill-all.sh
Start version 4.y in normal mode
From the new root of the scylla-monitoring-scylla-monitoring-4.y run
./start-all.sh -d /path/to/copy/data/dir
Point your browser to http://{ip}:3000 and see that the data is there.
Rollback to version 3.x
To rollback during the testing mode, follow Killing the new 4.y Monitoring stack in testing mode as explained previously and the system will continue to operate normally.
To rollback to version 3.x after you completed moving to version 4.y (as shown above), run:
./kill-all.sh
cd /path/to/scylla-grafana-3.x/
./start-all.sh -d /path/to/original/data/dir
Post-installation: Metrics back-filling
Starting from Scylla Monitoring version 3.8, Scylla Monitoring uses Prometheus’s recording rules for performance reasons. Recording rules perform some of the calculations when collecting the metrics instead of when showing the dashboards.
For example, this is a recording rule that calculates the p99 write latency:
- record: wlatencyp99
  expr: histogram_quantile(0.99, sum(rate(scylla_storage_proxy_coordinator_write_latency_bucket{}[60s])) by (cluster, dc, instance, shard, scheduling_group_name, le))
  labels:
    by: "instance,shard"
For a transition period, Scylla Monitoring version 3.x has a fall-back mechanism that if those recording rules are not present data will still be shown.
Scylla Monitoring versions 4.0 and newer will rely only on recording rules.
Note
If you upgrade from a version older than 3.8 without back-filling, latency historical data will not be shown.
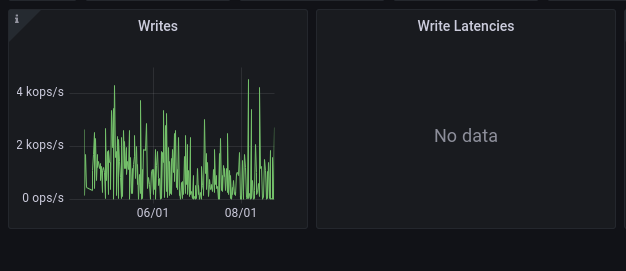
This is an example of missing latency graph
The following instructions are only relevant if you are upgrading from a version older than 3.8 to version 4.0 or higher, or if you are looking at historical data collected before you upgraded to 3.8.
For example, you keep your data (retention period) for a year, and you upgraded to version 3.8 three months ago.
In this example you have recording rules data only for the last three months, to be able to look at older latency information you will need to back-fill that missing period.
The following instructions are based on the recording rules backfilling section in the Prometheus documentation.
Determine the backfilling period
When you run the backfilling process you need to determine the start time and end time.
Determine the start time
The start time is your Prometheus retention time, by default it is set to 15 days. if you are not sure what Prometheus retention time is, you can check by logging in to your Prometheus server: http://{ip}:9090/status.
If you are running Scylla Monitoring version 3.8 or newer for longer than the retention period, you are done! You can skip the rest of this section.
For the rest of this example, we will assume that your retention time is 360 days.
Determine the end time
Typically, you need to back-fill the recording rules when you are using a long retention period, for example, you have a year of retention data, and you upgraded to Scylla Monitoring 3.8 about three months ago.
If you open the Overview dashboard and look at your entire retention time (in our example 1 year) you will see that while most of the graphs do show the data, the latency graphs have a missing period, in our example - from the entire year, the latency graph will only show the last three months.
That nine months gap (12 months minus 3) is what we want to fill with back-filling.
The point in time that the graphs start will be your back-filling end time. Check in the graph for the exact time.
Backfilling Process
backup
If you have a long retention period you are using an external directory that holds the Prometheus data, back it up, in case If you have a long retention period, you are using an external directory that holds the Prometheus data back it up; if something goes wrong in the process, you can revert the process.
To complete the process you will need to restart the monitoring stack at least once. If you are not using an external directory (The -d
command-line option) You cannot complete it.
Restart the monitoring stack
You need to stop the monitoring stack and run the stat-all.sh command with an additional flag:
-b "--storage.tsdb.allow-overlapping-blocks"
Create the data files
We will use the Promtool utility; it’s already installed for you if you are using the docker container. You will need the start time and end time for the process, in our example the start time is 360 days ago and the end time is 90 days ago.
The start and end times are in epoc, so you will need to translate the times to epoc. There are many ways to do this - for example, from the command line.
Run the following command to get the epoc time for 90 days ago: : echo $((`date +%s` - 3600*24*90))
Log in to your docker container and run the following (start and end should be the start and end in epoc time):
docker exec -it aprom sh
cd /prometheus/data/
promtool tsdb create-blocks-from rules \
--start $start \
--end $end \
--url http://localhost:9090 \
/etc/prometheus/prom_rules/back_fill/3.8/rules.1.yml
It will create a data directory in the directory where you run it.
The reason to run it under the /prometheus/data/ is you can be sure Prometheus has write privileges there.
Note
Depending on the time range and the number of cores, the process can take a long time. During testing it took an hour for every week of data, for a cluster with a total of 100 cores. Make sure that the creation process is not inerupt. You can split the time range to smaller durations (e.g. instead of an entire year, do it a weeks at a time).
Copy the data files
Make sure that the process is completed successfully - don’t start this section before you complete the previous sections.
Copy the data files to the Prometheus directory:
cp data/* .
The rules will be evaluated next time Prometheus will perform compaction. You can force it by restarting the server using docker restart aprom
Follow the logs docker logs aprom to see that the process works as expected. If there are no errors, you should now be able to
see the latency graphs over your entire retention time.
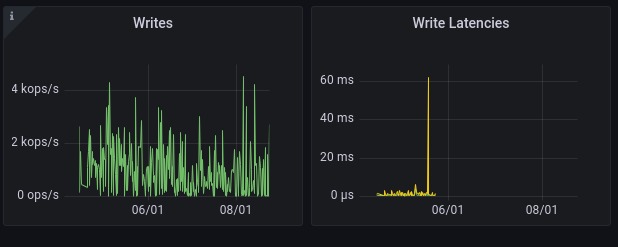
Un example: after loading half of the data