Was this page helpful?
Caution
You're viewing documentation for a previous version of ScyllaDB Monitoring. Switch to the latest stable version.
ScyllaDB Cloud Monitoring Datadog Integration
To allow external server scrapping, you will need to enable the Prometheus proxy. The Datadog agent reads from the proxy, which reads from the Promethues server.
Installing and configuring the Datadog Agent.
Add Datadog recording rules.
Loading ScyllaDB dashboard to Datadog.
Optionally load Monitor (Alerts).
ScyllaDB Monitoring Datadog Integration Overview
A typical ScyllaDB cluster generates thousands of metrics, sometimes even tens of thousands. The sheer number of metrics is too much for Datadog.
Instead of letting the Datadog agent scrap all metrics, the monitoring stack marks a small subset of metrics with a label and lets the Datadog agent scrap only those.
Install And configure the Datadog Agent
Start by installing DataDog Agent on a server with access to ScyllaDB Cloud Prometheus Proxy server, following Installation guide. The datadog agent should run on a machine that can reach the Prometheus Proxy server.
Once the Datadog agent is working, download the configuration file conf.yaml move it to: /etc/datadog-agent/conf.d/prometheus.d/conf.yaml
Edit the file. You must replace the cluster id (CLUSTER_ID) and the token (TOKEN).
Post configuration
Restart the agent based on your installation. ScyllaDB metrics should be visible in Datadog.
Note
By default, Datadog will not scrap per-shard metrics. To enable per-shard metrics, edit the conf.yaml file and replace dd=~”1” with dd=~”1|2”
Upload the Dashboard
Download the dashboard file dashboard.json.
Create a new dashboard in Datadog and import the json file you downloaded.
Using the Dashboard
We created a Datadog dashboard that resembles the Grafana dashboards.
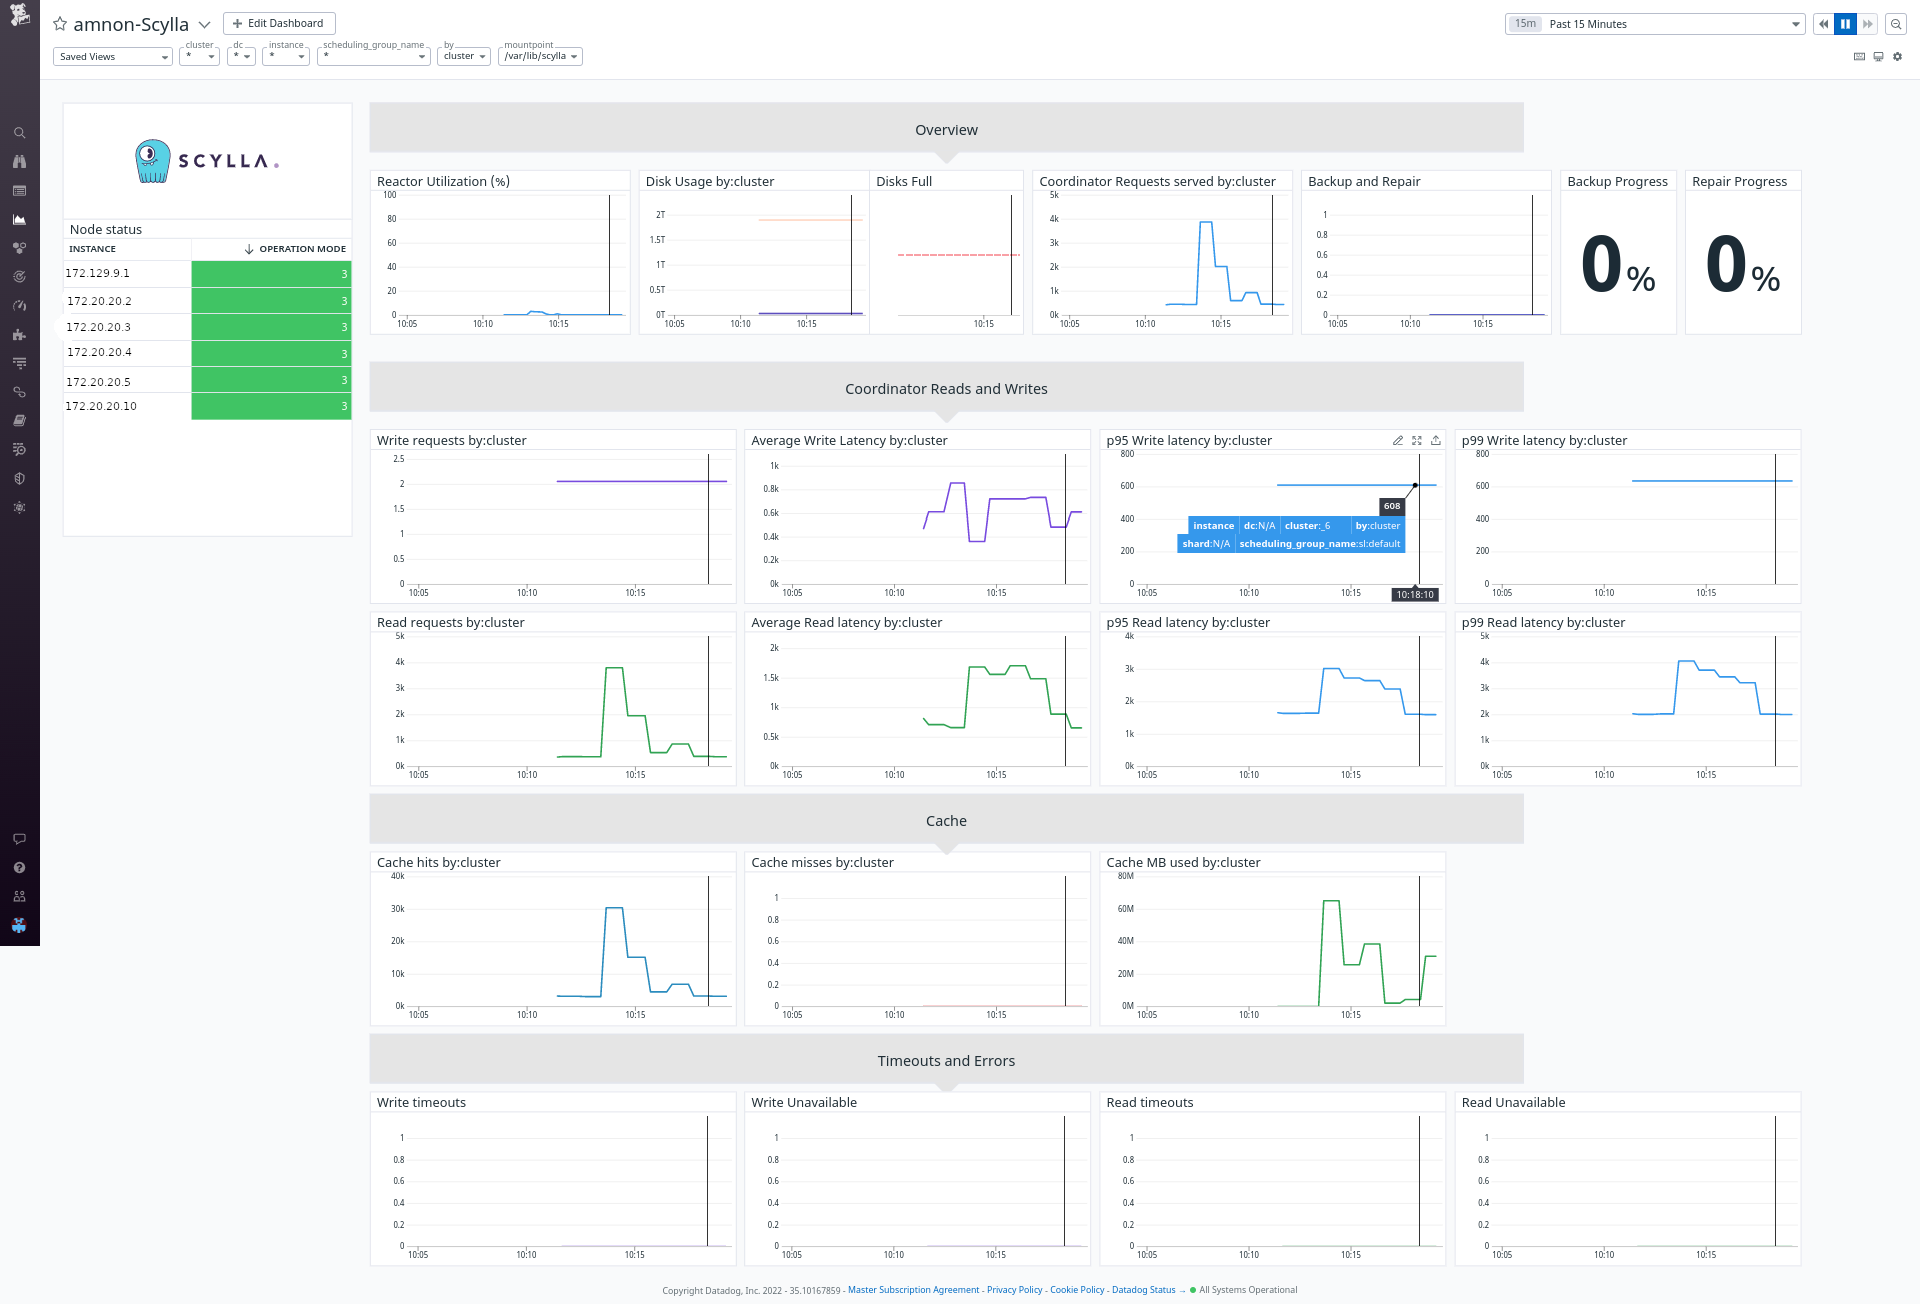
The dashboard contains some specific filtering and perspectives: First, you can choose between shard, instance, dc, or cluster view. This will aggregate the metrics in the graphs accordingly. Second, you can filter to see specific shards, nodes, or DCs.
Note
Pay attention that some of the combinations are conflicting. For example, you cannot filter by DC when looking at a cluster view. If no data displayed, remove the filters first.
Adding Monitor
Alerts in Datadog called Monitor. Download the monitor file monitor.json. Go to the Monitor section in datadog and import the json.