Was this page helpful?
Caution
You're viewing documentation for a previous version of ScyllaDB Monitoring. Switch to the latest stable version.
Deploying Scylla Monitoring Stack Without Docker
Introduction
The following instructions will help to deploy Scylla Monitoring Stack in cases where you can not use the recommended Docker version.
Please note, Scylla recommends you use the Docker version as it will provide you with most updated, current Scylla Monitoring system.
Scylla Monitoring uses the following components:
Alertmanager
Grafana Loki
Prometheus
Grafana
The common scenario for users who use their own standalone installation, is they already have such a server and would like to consolidate. We assume that that you already have Prometheus and Grafana running but we will add minimal installation instruction for all componenents.
We suggest that you follow the installation instruction of each of those products from their official documentation. It is also recommended that all servers will run as a service.
Minimal Production System Recommendations
CPU - at least 2 physical cores/ 4vCPUs
Memory - 15GB+ DRAM
Disk - persistent disk storage is proportional to the number of cores and Prometheus retention period (see the following section)
Network - 1GbE/10GbE preferred
Calculating Prometheus Minimal Disk Space requirement
Prometheus storage disk performance requirements: persistent block volume, for example an EC2 EBS volume
Prometheus storage disk volume requirement: proportional to the number of metrics it holds. The default retention period is 15 days, and the disk requirement is around 200MB per core, assuming the default scraping interval of 15s.
For example, when monitoring a 6 node Scylla cluster, each with 16 CPU cores, and using the default 15 days retention time, you will need minimal disk space of
6 * 16 * 200MB ~ 20GB
To account for unexpected events, like replacing or adding nodes, we recommend allocating at least x4-5 space, in this case, ~100GB. Prometheus Storage disk does not have to be as fast as Scylla disk, and EC2 EBS, for example, is fast enough and provides HA out of the box.
The main item to set an alert on is the available disk space in the monitoring system. Data is indefinitely accrued on the Prometheus data directory. The current monitoring solution does not churn data.
Note
Confirm before installing, that your Grafana and Prometheus versions are supported by the Scylla Monitoring Stack version you want to install. Scylla-Monitoring follows the latest Prometheus and Grafana releases tightly. See the Scylla Monitoring Stack Compatibility Matrix.
Install Scylla Monitoring Stack
The following procedure uses a CentOS 7 based instance
Download the latest Scylla Monitoring Stack release.
wget https://github.com/scylladb/scylla-monitoring/archive/refs/tags/scylla-monitoring-3.8.0.tar.gz
Open the tar
tar -xvf scylla-monitoring-*.tar.gz
Install Alertmanager
Tested with alertmanager 0.22.2 version
Install alertmanager
wget https://github.com/prometheus/alertmanager/releases/download/v0.22.2/alertmanager-0.22.2.linux-amd64.tar.gz
tar -xvf alertmanager-*.linux-amd64.tar.gz
Copy the following file:
rule_config.ymlfromscylla-monitoring-scylla-monitoring-3.5/prometheusdirectory toalertmanager.ymlin the alertmanager installation directory.
For example:
cp -p /home/centos/scylla-monitoring-scylla-monitoring-3.8.0/prometheus/rule_config.yml alertmanager-0.22.2.linux-amd64/alertmanager.yml
Start the Alertmanager
For example:
cd alertmanager-0.22.2.linux-amd64
./alertmanager
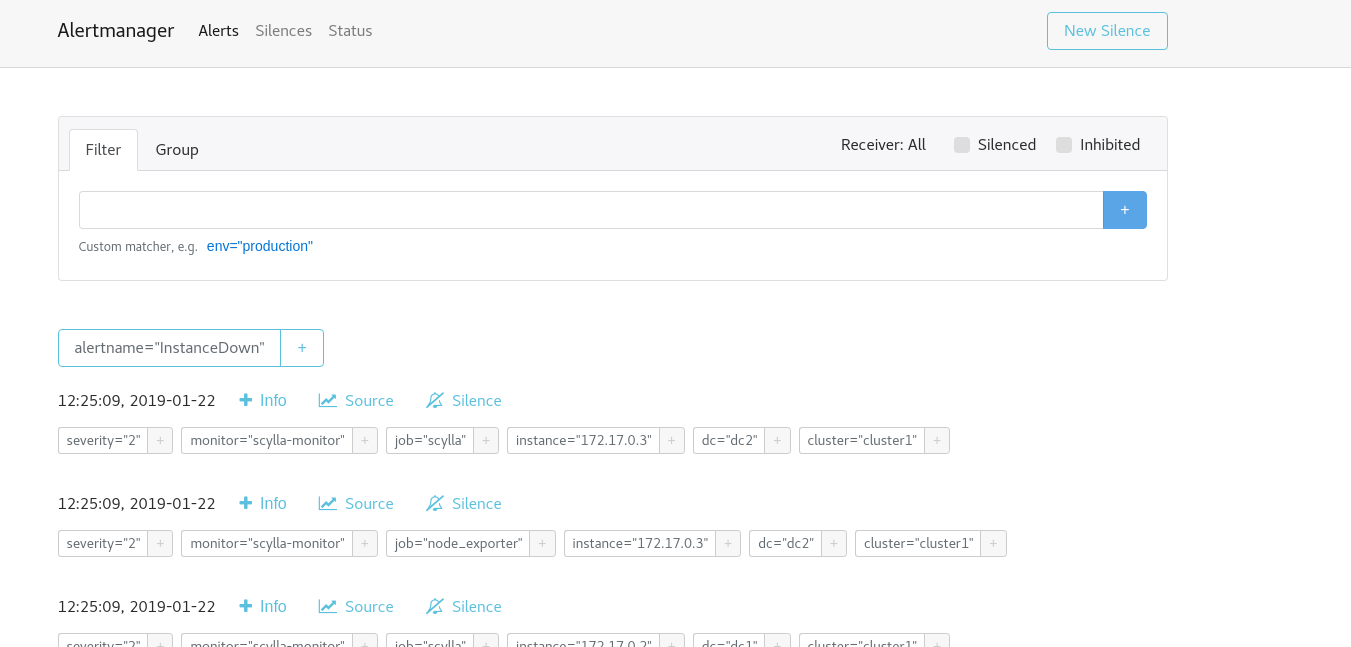
Verify that Alertmanager is up and running, point your browser to the Alertmanager IP:Port
For example:
http://192.168.135.166:9093/
Install Grafana Loki
Loki is a log aggregation system inspired by Prometheus. Scylla Monitoring uses Loki for alerts and metrics generation. It does not replaces your centralized logging server, but it can, check Loki-Grafana documentation if you want to use it for centralized log collection.
We recomand using Loki with containers, but you can install it locally as described in Loki installation
You will need to run both Loki and Promtail. Loki responsible for log parsing and acts as a Grafana and Proemtheus data-source and Generate alerts that are sent to the Alertmanager.
Promtail load logs into Loki, there are multiple ways of doing that, we suggest to use of rsyslog, this way you can add Promtail (and Loki) as a second log collection server.
Loki Related files
Loki has a configuration file and a rule file. You need to copy and modify the configuration.
mkdir -p /etc/loki/rules
mkdir -p /etc/loki/config
cp loki/rules/* /etc/loki/rules
cp loki/conf/loki-config.template.yaml /etc/loki/config/loki-config.yaml
Edit /etc/loki/config/loki-config.yaml and replace ALERTMANAGER with the alertmanager ip:port (i.e. localhost:9093)
Promtail Related files
Promtail has a configuration file. You need to copy and modify the configuration.
mkdir -p /etc/promtail/
loki/promtail/promtail_config.template.yml /etc/promtail/config.yml
Edit /etc/promtail/config.yml and replace LOKI_IP with Loki’s ip:port (i.e. localhost:3100)
Install Prometheus
Tested with Prometheus version 2.27.1
Note
If you already have a prometheus server, beside the expected scrap jobs, make sure you take the Prometheus rules directory. The files not only contains important alerts, they are containing recording rules, without it different asspects of the dashboards will not work.
Install Prometheus
wget https://github.com/prometheus/prometheus/releases/download/v2.27.1/prometheus-2.27.1.linux-amd64.tar.gz
tar -xvf prometheus-*.linux-amd64.tar.gz
2. Create Data and Config directories .. code-block:: shell
mkdir -p /prometheus/data mkdir -p /etc/prometheus/prom_rules/ mkdir -p /etc/scylla.d/prometheus/
Copy the following files:
scylla_servers.yml,prometheus.rules.ymlfromscylla-monitoring-scylla-monitoring-3.7.0/prometheusdirectory to Prometheus installation directory.
Copy prometheus/prometheus.yml.template to prometheus.yml
For example:
cp scylla-monitoring-scylla-monitoring-3.7.0/prometheus/prom_rules/*.yml/etc/prometheus/prom_rules/
cp scylla-monitoring-scylla-monitoring-3.7.0/prometheus/prometheus.yml.template /etc/prometheus/prometheus.yml
Edit the
prometheus.ymlfile to point to the correct static data sources.
Note
Make sure to include the honor_labels: false parameter in the prometheus.yml file.
vi /etc/prometheus/prometheus.yml
Set the alertmanger address and port by replacing AM_ADDRESS in the file.
For example if the alertmanager will run on the same host:
alerting:
   alertmanagers:
   - static_configs:
       - targets:
           - 127.0.0.1:9093
Replace the files in to point to the right local file, typically for scylla, node_exporter and manager_agent you can use the same file (scylla_servers.yml).
For example the scrape config for Scylla:
global:
  scrape_interval: 5s # By default, scrape targets every 5 second.
  scrape_timeout: 4s # Timeout before trying to scape a target again

  # Attach these labels to any time series or alerts when communicating with
  # external systems (federation, remote storage, Alertmanager).
  external_labels:
    monitor: 'scylla-monitor'

scrape_configs:
- job_name: scylla
  honor_labels: false
  file_sd_configs:
    - files:
      - /etc/scylla.d/prometheus/scylla_servers.yml
  relabel_configs:
    - source_labels: [__address__]
      regex:  '([^:]+)'
      target_label: __address__
      replacement: '${1}:9180'

    - source_labels: [__address__]
      regex:  '(.*):.+'
      target_label: instance
      replacement: '${1}'
Create and set
scylla_servers.ymlfile point to your Scylla nodes andscylla_manager_server.ymlfile to point to your Scylla Manager.
Note
There is no need to configure node_exporter_server. Instead, in the Prometheus scrape config of the node_exporter
you can use the same file you used for Scylla and Prometheus will assume you have a node_exporter running on each Scylla server.
An example for those files can be found under the Prometheus directory: prometheus/scylla_servers.example.yml and prometheus/scylla_manager_servers.example.yml
Note
You must have both files even if you are not using Scylla Manager
Add the labels for the cluster and data-center
scylla_servers.yml:
For example:
cat scylla_servers.yml
# List Scylla end points

- targets:
  - 192.168.66.6
  - 192.168.66.244
  labels:
    cluster: cluster1
    dc: dc1
- targets:
    - 172.17.0.3
  labels:
    cluster: cluster1
    dc: dc2
Note
See the previous note about deprecating the node_exporter_servers.yml file.
scylla_manager_server.yml
For example:
- targets:
  - 127.0.0.1:5090
Start Prometheus server:
For example:
cd scylla-monitoring-scylla-monitoring-3.7.0/
./prometheus --config.file=/etc/prometheus/prometheus.yml --storage.tsdb.path /prometheus/data
Data should start accumulate on: /prometheus/data
Verify that Prometheus is up and running, point your browser to the Prometheus IP:Port
For example:
http://192.168.135.166:9090/
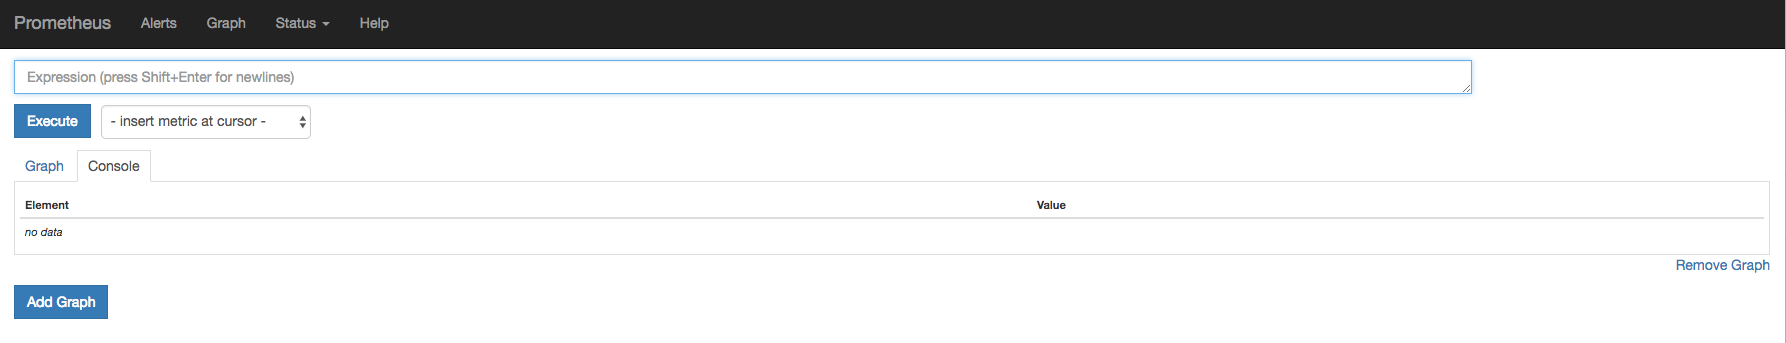
Prometheus console should be visible
Verify that the node_exporter and scylla metrics accumulating in the server by executing a query through the console
For example:
node_memory_MemFree
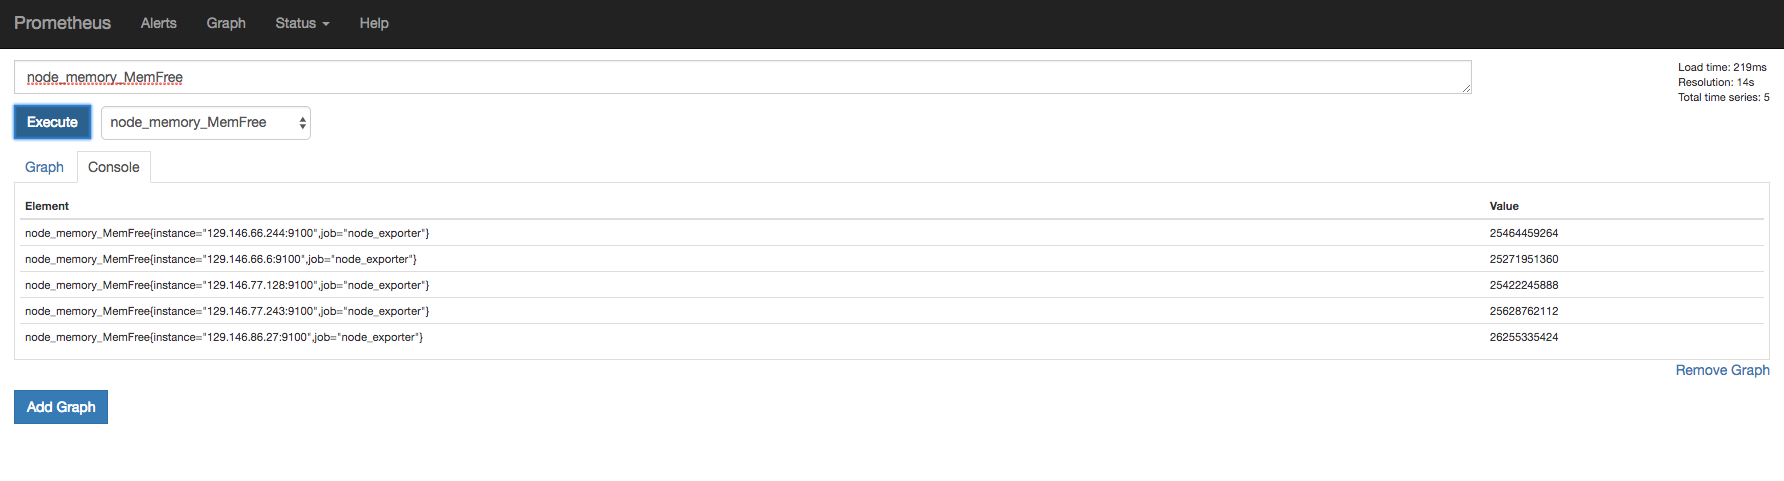
And
scylla_reactor_utilization
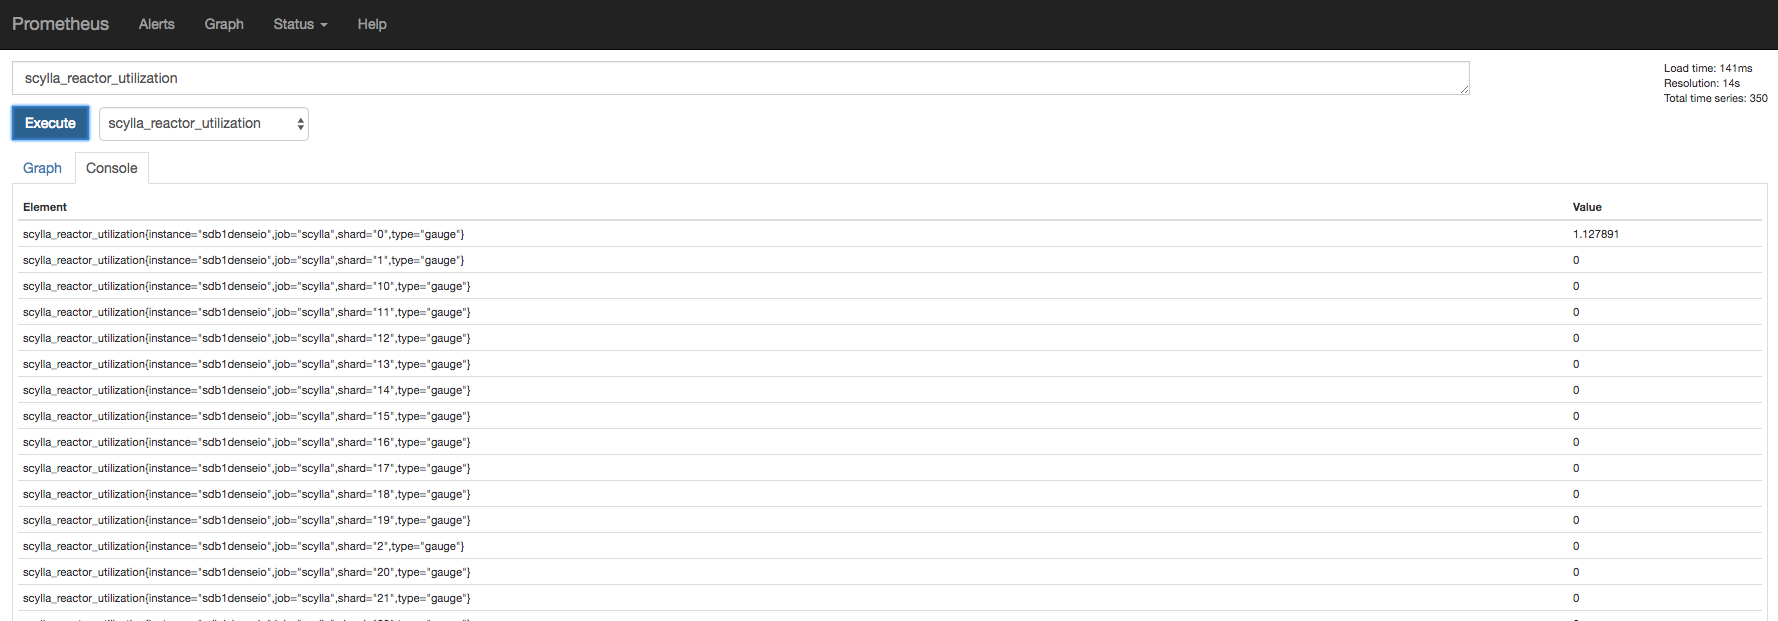
At this point Scylla is emitting the metrics and Prometheus is able to store them.
Install Grafana
Tested with Grafna 7.5.7
Install Grafana based on the instructions here
Depends if you installed Grafana from a repository (yum install), or if you downloaded the zip version, the directory structure will be different in the rest of the steps.
Access Scylla-Grafana-monitoring directory
cd scylla-monitoring-scylla-monitoring-3.7.0/
Copy the plugins to the grafana plugins directory (by default
/var/lib/grafana/)
sudo cp -r grafana/plugins /var/lib/grafana/
If you installed Grafana from packages, instead of /var/lib/grafana/ you should copy it to public/app inside the directory you
opened Grafana in.
For example:
cp -r grafana/plugins ../grafana-7.5.7/public/app
Provision the Dashboards
For example Scylla Open-source version 4.5 and Scylla manager version 2.4
For Grafana installed with yum install
sudo cp grafana/load.yaml /etc/grafana/provisioning/dashboards/
sudo mkdir -p /var/lib/grafana/dashboards
sudo cp -r grafana/build/* /var/lib/grafana/dashboards
For Grafana installed from packages
cp -p -r grafana/build/* ../grafana-7.5.7/public/build/
cp -p grafana/load.yaml ../grafana-7.5.7/conf/provisioning/dashboards/load.4.5.yaml
cp -p grafana/load.yaml ../grafana-7.5.7/conf/provisioning/dashboards/load.manager_2.4.yaml
Edit the load.* files in /home/centos/grafana-7.5.7/conf/provisioning/dashboards/ for the correct path,
for example load.4.5.yaml would point to: /home/centos/grafana-7.5.7/public/build/ver_4.5.
Note
A note about using folders, if you provision multiple Scylla versions, use the version as a folder name. Otherwise, no need to configure a FOLDER.
Set the data source by copy
datasource.ymland edit it
sudo cp grafana/datasource.yml /etc/grafana/provisioning/datasources/
For Grafana installed from packages
cp -p grafana/datasource.yml /home/centos/grafana-7.5.7/conf/provisioning/datasources/
You should set the Prometheus and the alertmanager IP and port.
For example
sudo cat /etc/grafana/provisioning/datasources/datasource.yml
apiVersion: 1
datasources:
 - name: prometheus
   type: prometheus
   url: http://192.168.135.167:9090
   access: proxy
   basicAuth: false

 - name: alertmanager
   type: camptocamp-prometheus-alertmanager-datasource
   orgId: 1
   typeLogoUrl: public/img/icn-datasource.svg
   access: proxy
   url: http://192.168.135.166:9093
   password:
   user:
   database:
   basicAuth:
   isDefault:
   jsonData:
     severity_critical: '4'
     severity_high: '3'
     severity_warning: '2'
     severity_info: '1'
Start the Grafana service
For Grafana installed with yum install
sudo service grafana-server start
For Grafana installed from packages:
cp -p /home/centos/grafana-7.5.7/conf/sample.ini /home/centos/grafana-7.5.7/conf/scylla.ini
Edit scylla.ini to reflect the right paths in the paths section of the file.
plugins = /home/centos/grafana-7.5.7/data/plugins
provisioning = /home/centos/grafana-7.5.7/conf/provisioning
Start the server:
cd /home/centos/grafana-7.5.7/
./bin/grafana-server -config /home/centos/grafana-7.5.7/conf/scylla.ini
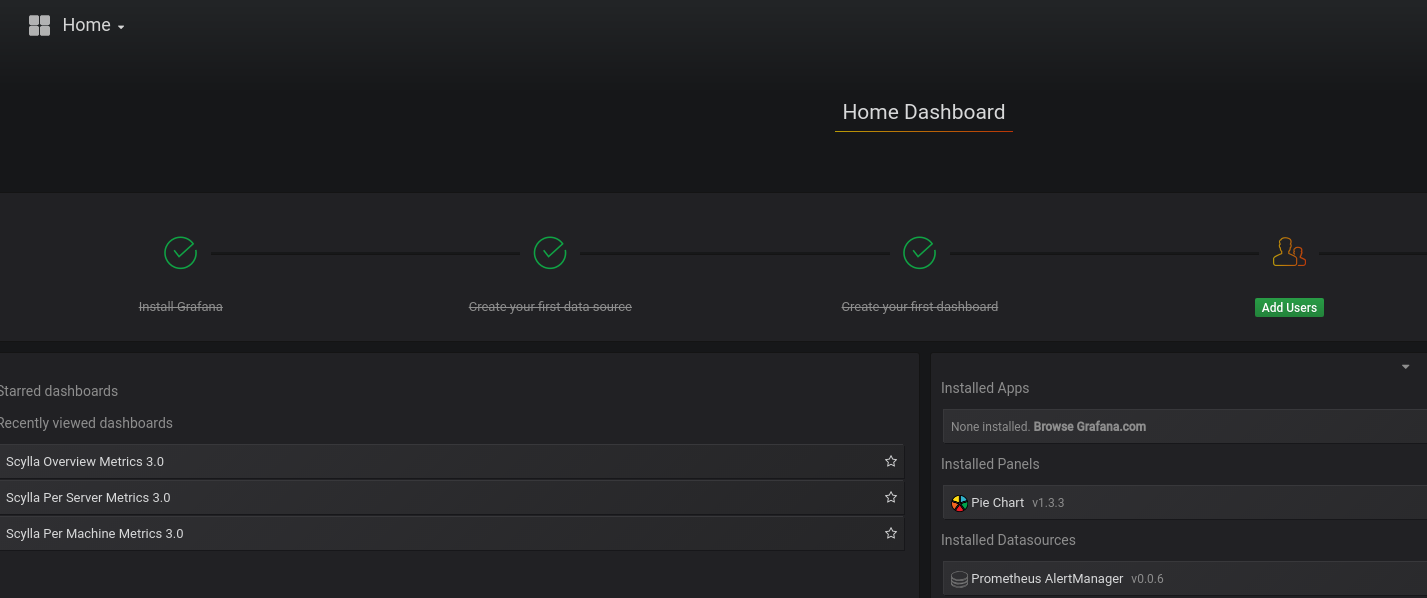
Make sure Grafana is running
Point your browser to the Grafana server port 3000, the assumption is that Grafana and Prometheus are collocated on the same server.