Was this page helpful?
Caution
You're viewing documentation for a previous version of ScyllaDB Monitoring. Switch to the latest stable version.
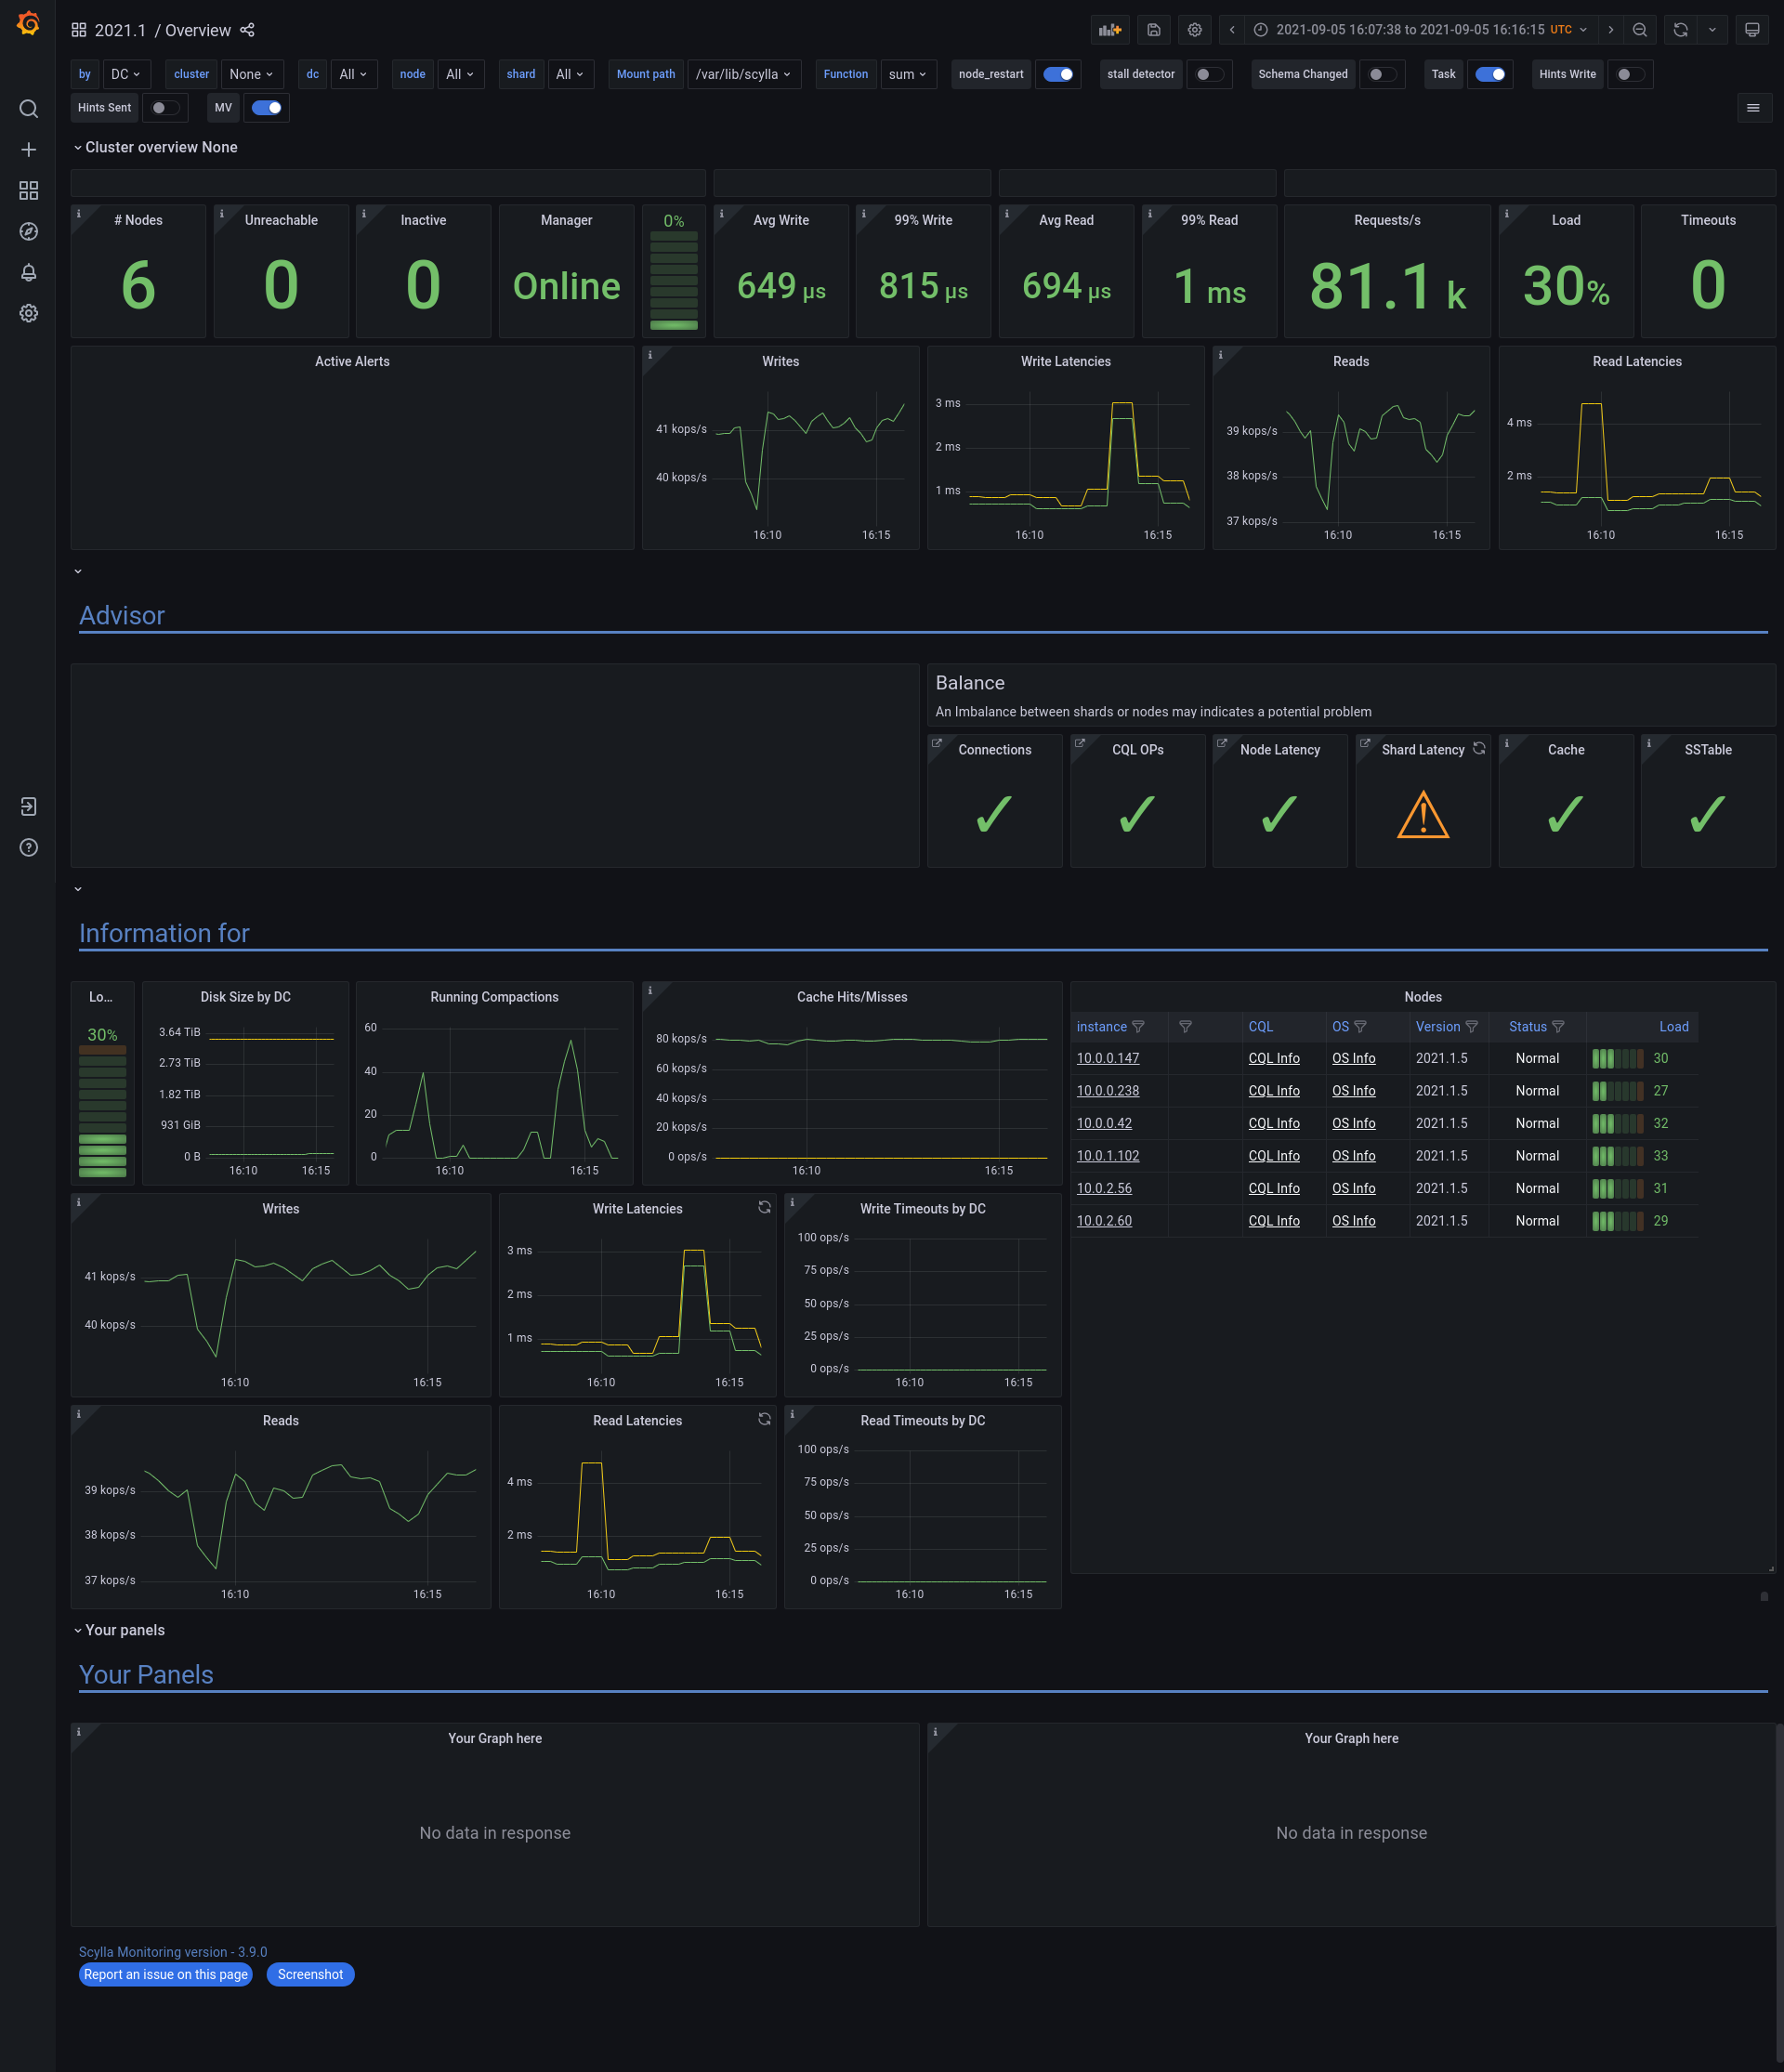
Scylla Monitoring Stack
Scylla Monitoring Stack is a full stack for Scylla monitoring and alerting. The stack contains open source tools including Prometheus and Grafana, as well as custom Scylla dashboards and tooling.
The Scylla Monitoring Stack consists of multiple components, wrapped in Docker containers:
prometheus - Collects and stores metrics
grafan-loki - Parses logs and generates metrics and alerts
alertmanager - Handles alerts
grafana - Dashboards server
A few optional components are used for additional services
grafana-image-renderer - Allows you to download a dashboard as an image.
Thanos sidecar - Allows a centralized Thanos server to read from the local Prometheus server.
High Level Architecture
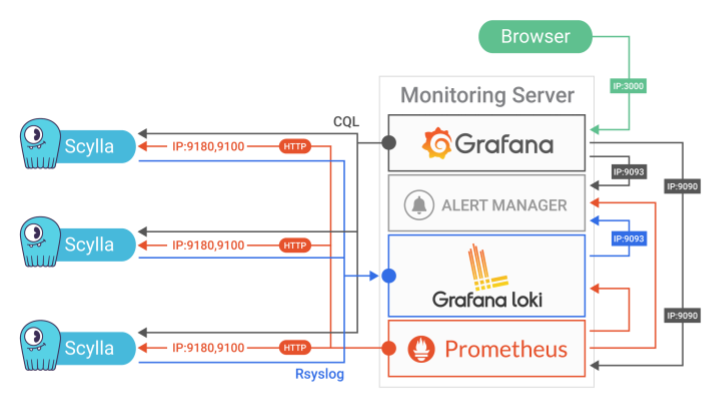
We use Prometheus for metrics collection and storage, and to generate alerts. Prometheus collects Scylla’s metrics from Scylla and the host metrics from the node_exporter agent that runs on the Scylla server.
We use Loki for metrics and alerts generation based on logs, Loki gets the logs from rsyslog agents that run on each of the Scylla servers.
The alertmanager, receives alerts from Prometheus and Loki and distributes them to other systems like email and slack.
We use Grafana to display the dashboards. Grafana gets its data from Prometheus, the alertmanager and directly from Scylla using CQL.
Choose a topic to get started:
Scylla Monitoring Stack lesson on Scylla University
For older versions of Scylla Monitoring Stack Documentation see here.